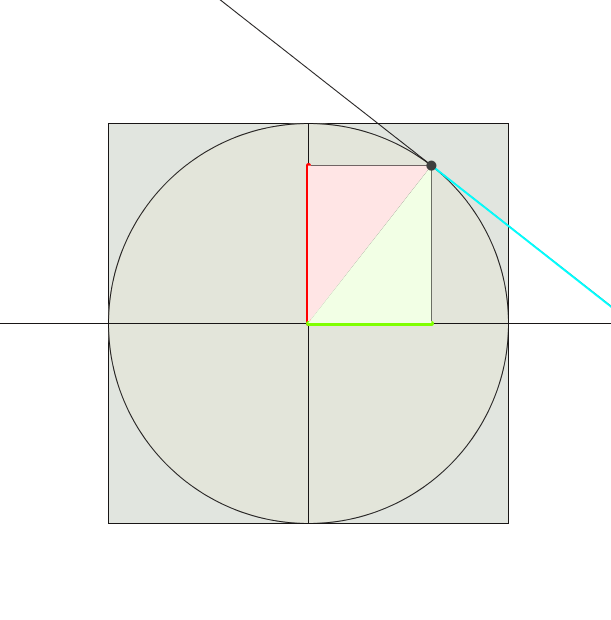
Een dynamische weergave van de verhouding van sinus, cosinus en tangens.
var cnv;
var straal;
var center;
var t=0;
var puntOmtrek, puntTangens;
var straal;
var teller;
var triangle;
var loop=true;
var cosinus, sinus, tangens;
var adjustStraal=4;
function setup() {
cnv=createCanvas(800,600);
cnv.mouseClicked(toggle);
//cnv.parent('cirkel');
straal=125;
center= createVector(0,0);
colorMode(HSB,200);
}
function draw() {
if(loop){
background(200);
//0,0 naar het centrum plaatsen
translate(width/2,height/2);
strokeWeight(1);
stroke(0,20,20);
fill(21);
//rechthoek voor info
rect(center.x-2*straal-30, center.y-2*straal-30, 120, 100);
fill(55,5,180);
//de cirkel en de assen
rect(center.x-straal, center.y-straal, 2*straal, 2*straal);
fill(40,10,180);
ellipse(center.x, center.y, 2*straal, 2*straal);
//horizontale as
line(center.x-straal*adjustStraal, center.y,center.x+straal*adjustStraal,center.y);
//verticale as
line(center.x,center.y-straal, center.x, center.y+straal);
//nu punt op omtrek
cosinus=cos(radians(t));
sinus=-sin(radians(t));
tangens=tan(radians(t));
fill(0,200,180);
text("sin: "+ nf(sinus, 1,2), -straal*2.1+10, -straal*2.2+15);
text("sin x cos: "+ nf((sinus*cosinus),1,2), -straal*2.1+10, -straal*2.2+70);
puntOmtrek=createVector(center.x + cos(radians(t))*straal,center.y + sin(radians(t))*straal);
var tangent = createVector(puntOmtrek.y - center.y, center.x - puntOmtrek.x);
tangent.normalize();
tangent.mult(straal*adjustStraal);
line(puntOmtrek.x-tangent.x, puntOmtrek.y - tangent.y, puntOmtrek.x + tangent.x, puntOmtrek.y + tangent.y);
var Snijpunt=lineLine(puntOmtrek.x-tangent.x, puntOmtrek.y - tangent.y, puntOmtrek.x + tangent.x, puntOmtrek.y + tangent.y,center.x-straal*adjustStraal, center.y,center.x+straal*adjustStraal,center.y);
//puntTangens=new PVector(-tan(radians(t))*straal,straal);
//strokeWeight(5);
//stroke(30,200,200);
fill(100,200,200);
text("tan: "+ nf(-tangens, 1,2), -straal*2.1+10, -straal*2.2+45);
strokeWeight(2);
stroke(100,200,200);
line(puntOmtrek.x, puntOmtrek.y, Snijpunt.x, Snijpunt.y);
strokeWeight(1);
stroke(0,20,20);
//lijn uit centrum naar omtrek
line(center.x, center.y, puntOmtrek.x, puntOmtrek.y);
//lijn puntomtrek naar y-as
line(puntOmtrek.x,puntOmtrek.y,puntOmtrek.x,0);
//lijn puntomtrek naar x-as
line(puntOmtrek.x,puntOmtrek.y,0, puntOmtrek.y);
//lijnen op de assen
//sinus
strokeWeight(5);
stroke(200,200,200);
line(center.x, center.y, center.x, puntOmtrek.y);
noStroke();
fill(200,20,200);
beginShape();
vertex(center.x,center.y);
vertex(puntOmtrek.x,puntOmtrek.y);
vertex(center.x, puntOmtrek.y);
endShape(CLOSE);
//cosinus
fill(50,200,200);
text("cos: "+ nf(cosinus, 1,2), -straal*2.1+10, -straal*2.2+30);
strokeWeight(5);
stroke(50,200,200);
line(center.x, center.y, puntOmtrek.x, center.y);
fill(50,20,200);
noStroke();
beginShape();
vertex(center.x,center.y);
vertex(puntOmtrek.x,puntOmtrek.y);
vertex(puntOmtrek.x, center.y);
endShape(CLOSE);
//PuntOmtrek duidelijk tekenen
noStroke();
fill(50,200.200);
ellipse(puntOmtrek.x,puntOmtrek.y, 10,10);
t-=0.3;
}
}
function lineLine( x1, y1, x2, y2, x3, y3, x4, y4) {
var Snijpunt;
Snijpunt=createVector(0,0);
// calculate the distance to intersection point
var uA = ((x4-x3)*(y1-y3) - (y4-y3)*(x1-x3)) / ((y4-y3)*(x2-x1) - (x4-x3)*(y2-y1));
var uB = ((x2-x1)*(y1-y3) - (y2-y1)*(x1-x3)) / ((y4-y3)*(x2-x1) - (x4-x3)*(y2-y1));
// if uA and uB are between 0-1, lines are colliding
if (uA >= 0 & uA <= 1 && uB >= 0 && uB <= 1) {
// optionally, draw a circle where the lines meet
var intersectionX = x1 + (uA * (x2-x1));
var intersectionY = y1 + (uA * (y2-y1));
//fill(180,200,200);
noStroke();
fill(120,200,200);
ellipse(intersectionX,intersectionY, 10,10);
Snijpunt=createVector(intersectionX,intersectionY);
return Snijpunt;
}
return Snijpunt;
}
function toggle() {
if(loop==true){
loop=false;
}else{
loop=true;
}
}
Klik op de figuur om de animatie te stoppen.
4 mei 2018 leopold